> For the complete documentation index, see [llms.txt](https://docs-conversational-ai.syntphony.com/llms.txt). Markdown versions of documentation pages are available by appending `.md` to page URLs; this page is available as [Markdown](https://docs-conversational-ai.syntphony.com/syntphony-live-agent-console/supervisor-workspace/index-1.md).
# Dashboard
Comprehensive analytics interface for monitoring operational performance.
## Purpose
Provide supervisors and operations teams with team-level and agent-level analytics to monitor service quality and efficiency.
## Who this is for
Supervisors, operations managers, and administrators.
## Prerequisites
* Conversations are routed through configured sources.
* Teams and agents are active in the selected time range.
## Feature overview
* Statistics: View current team/agent data and active chat count.
* Performance Metrics: Track key indicators like response time and resolution rates.
* Teams Performance: Team performance visualization with detailed per-agent metrics in that specific team.
* Agent Metrics Tab: Dedicated list and detail screens for agent aggregated metrics.
* Time-based Analysis: Filter metrics by different time periods (hour, day, week, month).
* Data Export: Extract reports for further analysis.
* Customer Satisfaction: Monitor user ratings and feedback.
## Dashboard views
The dashboard layout is optimized to improve information density and make key indicators visible without additional navigation.
### Team metrics view
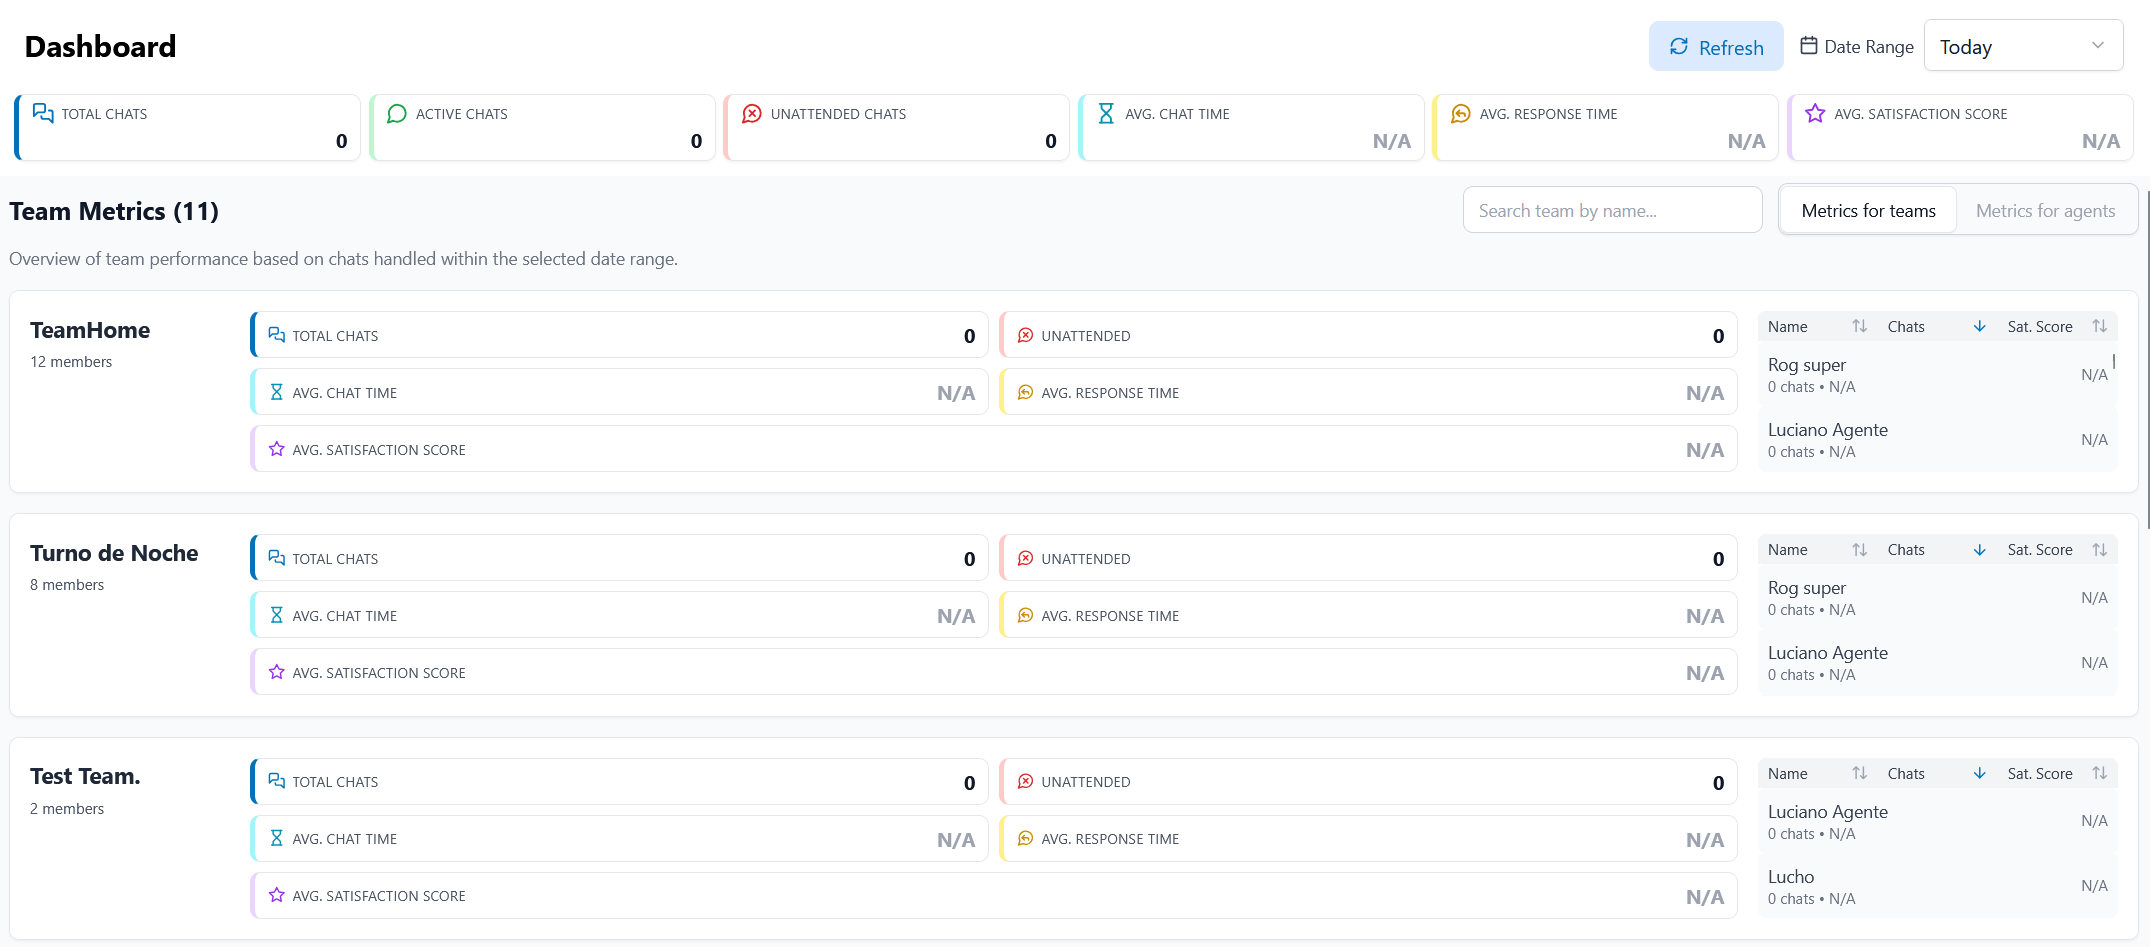
Displays an overview of team performance using informative cards and a structured table showing total and average values. The Team Metrics view includes:
* **Team-level Metric Cards:** Quick-glance statistics summarizing overall chat volume, resolved and unresolved cases, average response time, average handling time, and customer satisfaction score for each team.
* **Detailed Rows:** Breakdown for each team with key metrics, making it easy to compare across multiple teams.
* **Filters and Options:** Use the options bar (as shown in the dashboard image) to:
* Select a date or time range for all analytics (e.g., hour, day, week, month).
* Filter metrics by specific teams or groups.
* Export data for reporting (to CSV or XLS).
* Switch between viewing metrics aggregated for all teams or for individual teams.
* Toggle between different metrics (e.g., chat volume, response times, satisfaction scores) using metric selection controls.
This section is designed with an expanded card layout for rapid scanning, ensuring supervisors can quickly spot trends, issues, or outstanding performance at the team level.
### Agent metrics list view
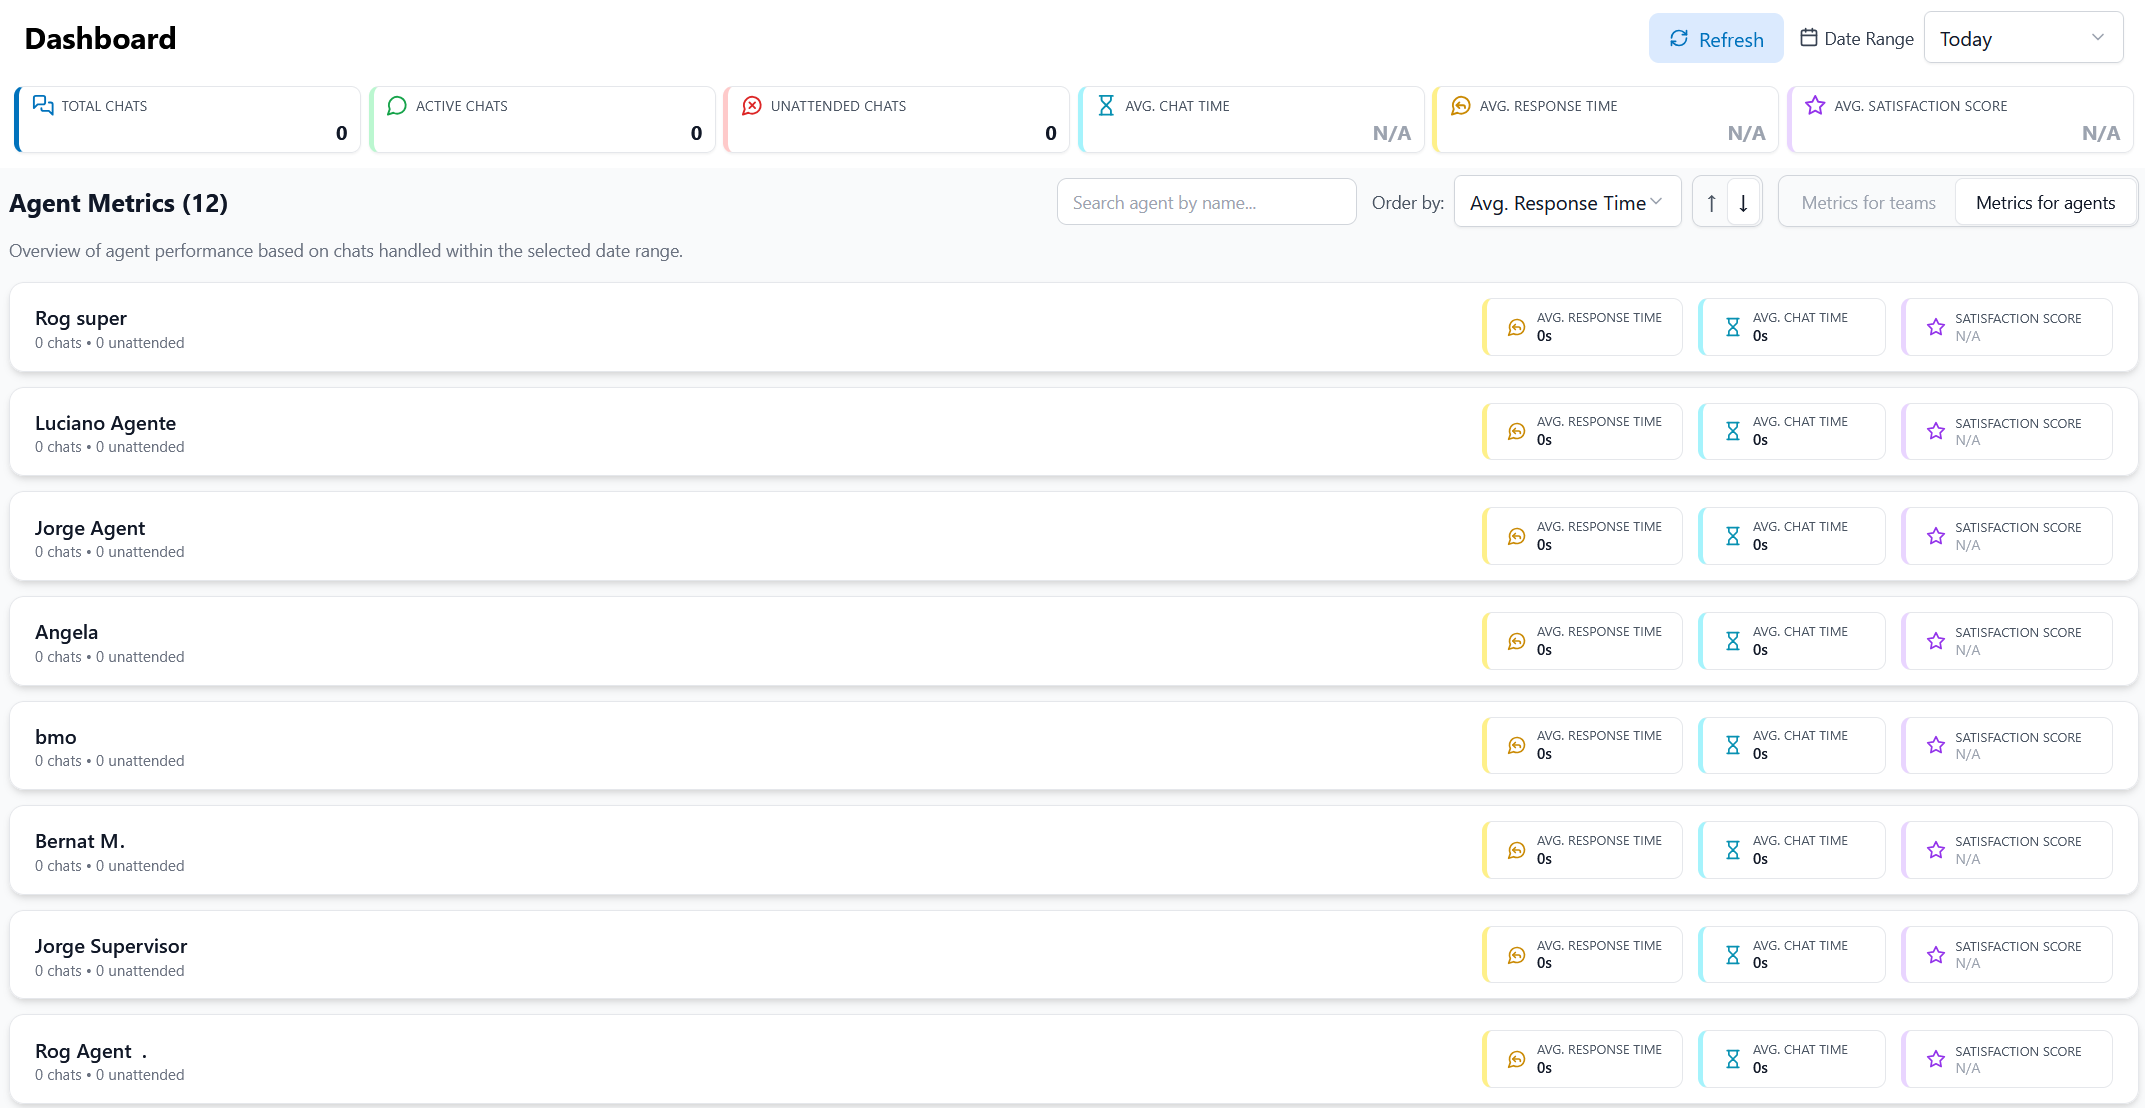
Adds a dedicated agent list screen where supervisors can scan each agent's performance indicators quickly.
From this view, supervisors can:
* Search agents by name.
* Sort by a selected metric (for example, **Avg. Response Time**).
* Switch between **Metrics for teams** and **Metrics for agents**.
Each agent row displays:
* Chat context (`chats` and `unattended`).
* **Avg. Response Time**.
* **Avg. Chat Time**.
* **Satisfaction Score**.
### Agent metrics detail view
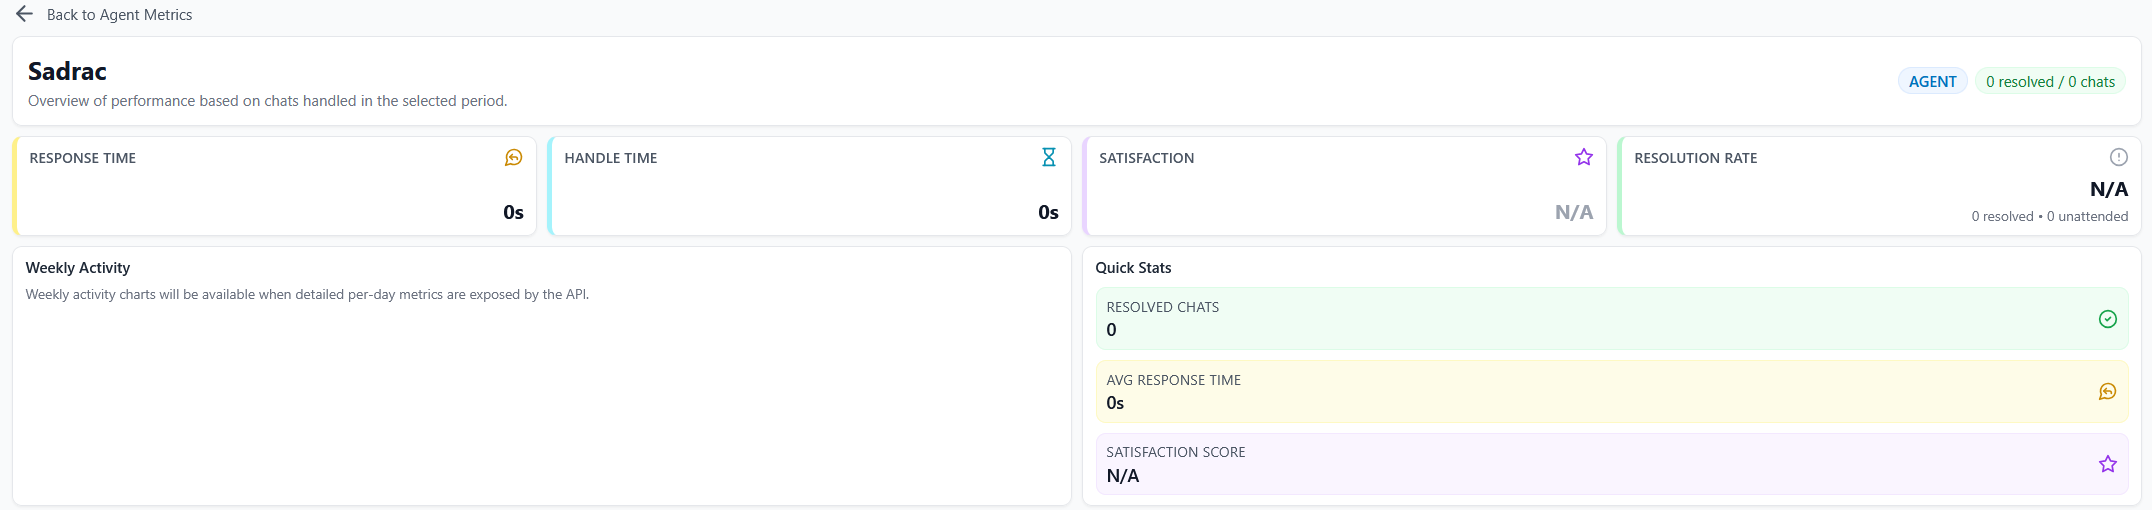
Selecting an agent opens a detail screen with focused performance metrics and quick stats for that specific user.
The detail screen includes:
* KPI cards for **Response Time**, **Handle Time**, **Satisfaction**, and **Resolution Rate**.
* A **Weekly Activity** panel (shown when detailed per-day data is available).
* A **Quick Stats** panel with **Resolved Chats**, **Avg Response Time**, and **Satisfaction Score**.
## Reference sections
* [Metrics and definitions](/syntphony-live-agent-console/supervisor-workspace/index-1/metrics-and-definitions.md)
* [Chat counting and system behavior](/syntphony-live-agent-console/supervisor-workspace/index-1/chat-counting-and-system-behavior.md)
## Expected outcome
* Teams can track attended versus unattended demand.
* Agent-level metrics support coaching and staffing decisions.
* Time-based comparisons help validate operational changes.
## Related pages
* [Archived Tab](/syntphony-live-agent-console/supervisor-workspace/archived-tab.md)
* [Settings](/syntphony-live-agent-console/supervisor-workspace/settings.md)
* [Teams Tab](/syntphony-live-agent-console/supervisor-workspace/index.md)
* [Glossary](/syntphony-live-agent-console/getting-started/glossary.md)
* [What's New](/syntphony-live-agent-console/whats-new.md)
---
# Agent Instructions
This documentation is published with GitBook. GitBook is the documentation platform designed so that both humans and AI agents can read, navigate, and reason over technical content effectively. Learn more at gitbook.com.
## Querying This Documentation
If you need additional information that is not directly available in this page, you can query the documentation by asking a question.
Perform an HTTP GET request on the following URL with the `ask` and `goal` query parameters:
```
GET https://docs-conversational-ai.syntphony.com/syntphony-live-agent-console/supervisor-workspace/index-1.md?ask=&goal=
```
`ask` is the immediate question: it should be specific, self-contained, and written in natural language.
`goal` is what the user is ultimately trying to achieve, the reason they need the answer. Sharing it helps GitBook give you a better, more relevant answer. A goal is most helpful when it describes the outcome the user wants rather than restating the question. For example, with `ask=how do I create an API token`, a goal like `automate deployments from our CI pipeline` lets GitBook tailor the answer to that use case.
The response will contain a direct answer to the question and relevant excerpts and sources from the documentation.
Use this mechanism when the answer is not explicitly present in the current page, you need clarification or additional context, or you want to retrieve related documentation sections.